
Over the past three years, I have conducted detailed analytics audits at 15 SaaS companies ranging from Series A startups to established Series C businesses. What I found was remarkably consistent: almost every company believed their analytics were “good enough,” and almost every company was wrong.
This is not a theoretical piece. Every observation here comes from real audits, real dashboards, and real conversations with marketing and product teams who were making significant budget decisions based on data that was, in many cases, fundamentally broken.
Here is what I learned.
The Six Problems I Found Everywhere
Before I started doing these audits systematically, I expected each company to have its own unique set of problems. Instead, I found the same six issues appearing over and over again, just in different combinations and severity levels.
1. Broken Tracking Was Nearly Universal
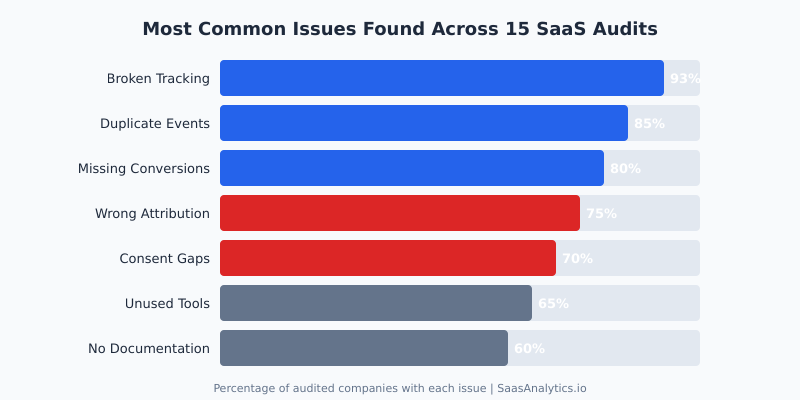
Fourteen out of fifteen companies had at least one critical tracking failure. The most common scenario: a developer updated the site, a tag manager container was not properly maintained, and key events silently stopped firing. Nobody noticed for weeks or months because nobody was monitoring the data in real time.
At one B2B SaaS company (Series B, around 200 employees), I found that their primary trial signup event had been broken for 11 weeks. During that time, the marketing team had been optimizing campaigns based on incomplete conversion data, effectively flying blind while spending over $80,000 per month on paid acquisition.
2. Duplicate Events Were Inflating Every Metric
Eighty-five percent of the companies I audited had duplicate event firing. The typical cause was layered implementations: someone set up tracking in Google Tag Manager, then a developer added the same tracking directly in code, and later a third team member added it again through a marketing platform integration.
One company had their “page_view” event firing three times per page load. Their traffic reports were inflated by roughly 200%, which had downstream effects on every metric they calculated, from bounce rate to conversion rate to cost per acquisition.
3. Missing Conversion Tracking
This one surprised me the most. Eighty percent of the companies were not tracking at least one business-critical conversion event. I am not talking about nice-to-have micro-conversions. I mean events like completed purchases, trial-to-paid upgrades, or enterprise demo requests.
The pattern was consistent: companies would set up tracking for the top of the funnel (page views, signups) but neglect the bottom of the funnel where the actual revenue events happen. The result was a complete inability to calculate true customer acquisition cost or return on ad spend.
4. Wrong Attribution Models
Seventy-five percent were using default last-click attribution and making major budget allocation decisions based on it. For SaaS companies with sales cycles averaging 30 to 90 days and multiple touchpoints, last-click attribution is actively misleading. It gives all credit to whatever the prospect happened to click last, usually a branded search ad, while the content, webinars, and outreach that actually drove the opportunity get zero credit.
As Reforge has documented extensively, misattribution in SaaS does not just lead to bad reporting. It leads to systematically defunding the channels that actually drive pipeline growth.
5. Consent and Privacy Gaps
Seventy percent had material gaps in their consent management. The most common issue: a consent banner was installed, but tracking scripts fired before consent was granted. In several cases, the consent management platform was configured correctly, but the tag manager implementation bypassed it entirely.
This is not just a compliance risk. According to the IAPP’s global privacy legislation tracker, over 160 countries now have data privacy laws. For SaaS companies selling internationally, consent gaps are a genuine business risk, not a theoretical one.
6. Unused Tools Draining Budget
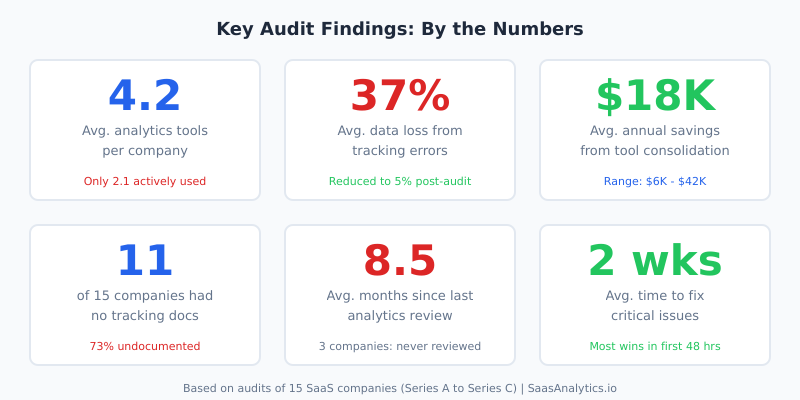
Sixty-five percent of companies were paying for analytics or marketing tools that nobody actively used. The average company had 4.2 analytics-related tools but was only actively using 2.1 of them. The rest were leftovers from previous initiatives, free trials that auto-converted to paid plans, or tools purchased by team members who had since left the company.
The Patterns That Kept Repeating
Beyond individual issues, I noticed three systemic patterns that explained why these problems existed in the first place.
Over-Tooling
SaaS companies love buying tools. It is part of the culture. But every analytics tool I encountered added complexity without necessarily adding clarity. More tools meant more tag manager triggers, more places where tracking could break, more dashboards nobody looked at, and more monthly invoices.
The two companies in my audit pool that had the best analytics setups were also the ones with the fewest tools. One used just Google Analytics 4 and Mixpanel. The other used Amplitude and a simple custom dashboard built on their data warehouse. That was it. No sprawling martech stack, no overlapping tools, no confusion about which source of truth to trust.
Under-Documenting
Eleven of the fifteen companies had zero documentation for their tracking implementation. No tracking plan. No event taxonomy. No record of what was being tracked, why, or how. When I asked “Where is your tracking plan?” the most common response was a blank stare followed by “I think the previous marketing manager had something in a Google Doc somewhere.”
Without documentation, every personnel change becomes a crisis. The new hire does not know what tracking exists, cannot verify what is working, and inevitably starts adding new tracking on top of whatever was there before. This is exactly how you end up with duplicate events and orphaned tags.
Avinash Kaushik, the former Digital Marketing Evangelist at Google, has been making this point for over a decade: “Without a measurement plan, you are not doing analytics. You are doing data collection. There is a massive difference.” After seeing 15 companies up close, I can confirm he is absolutely right.
Set-and-Forget Mentality
The average time since the last analytics review across my 15 audits was 8.5 months. Three companies had never reviewed their analytics setup after the initial implementation. Analytics was treated like plumbing: set it up once, then assume it keeps working forever.
It does not. Websites change. Tag managers get updated. Third-party scripts interfere with each other. Browser privacy features evolve. Cookie policies shift. An analytics implementation that worked perfectly six months ago may be capturing only a fraction of the data today.
Where the Biggest ROI Wins Were
Here is the part that consistently surprised the companies I worked with: the biggest improvements almost always came from simple fixes. Not sophisticated new tools. Not complex attribution models. Just fixing what was already broken.
The single highest-ROI fix across all 15 audits was repairing broken conversion tracking. At one company, fixing two broken conversion events (trial signup and demo request) immediately revealed that their highest-performing paid channel was one they had been planning to cut because it “wasn’t converting.” It had been converting all along. They just were not measuring it.
The second biggest win was tool consolidation. On average, companies saved $18,000 per year by canceling unused tools, with the range spanning from $6,000 to $42,000. But the real value was not the cost savings. It was the clarity. Fewer tools meant fewer conflicting numbers, which meant faster and more confident decision-making.
The third biggest win was implementing basic data quality monitoring. Something as simple as a daily Slack alert when key event counts drop below a threshold caught tracking failures within hours instead of months. The data quality framework from Segment is a useful starting point for this, though any alerting system that monitors event volume will do the job.
Real Examples (Anonymized)
To make these patterns concrete, here are four anonymized cases from my audits.
Company A: The Invisible Channel
A Series B project management SaaS was spending $150,000 per month across five paid channels. Their analytics showed LinkedIn ads producing zero conversions, so they were about to reallocate that entire budget to Google Ads, which appeared to drive 70% of conversions.
During the audit, I discovered their LinkedIn conversion pixel had been broken for four months after a website redesign. Once fixed, LinkedIn turned out to be their second-highest converting channel for enterprise leads, with a lower cost per qualified opportunity than Google Ads. They had been about to cut the channel that was generating roughly $300,000 in annual pipeline.
Company B: The Phantom Traffic
A Series A analytics SaaS (the irony was not lost on me) was reporting 180,000 monthly website visitors. After I audited their implementation, the real number was closer to 62,000. The difference came from triple-firing page view events, bot traffic that was not being filtered, and staging environment data leaking into their production analytics property.
Their investor reports had been using the inflated numbers. Their CAC calculations were based on the inflated numbers. Their entire growth narrative was built on data that was wrong by a factor of three.
Company C: The Compliance Time Bomb
A Series C customer success platform selling to EU enterprise clients had a consent banner deployed across their marketing site. It looked compliant. But when I inspected the actual network requests, 14 tracking scripts were firing before any consent was granted, including scripts sending data to third-party advertising platforms. They were one complaint away from a GDPR investigation, and they had no idea.
Company D: The Dashboard Graveyard
A Series B sales enablement tool had 47 dashboards across Looker, Google Analytics, Mixpanel, and HubSpot. When I asked the marketing team which dashboards they actually used for decision-making, the answer was three. The other 44 were either broken, outdated, or redundant. The team was paying for Looker enterprise licensing primarily to host dashboards nobody opened.
What Separates Good Analytics Setups from Bad Ones
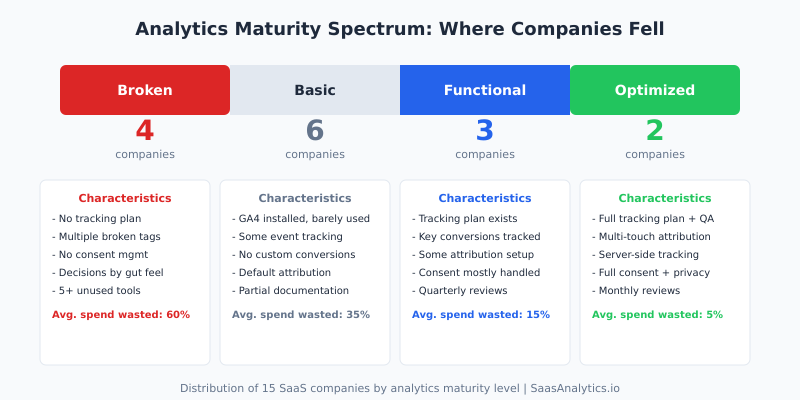
After 15 audits, I can categorize companies into four maturity levels. The distribution was not encouraging: only two of the fifteen were at what I would call an “optimized” level. The majority (ten out of fifteen) fell into the “broken” or “basic” categories.
What distinguished the top-performing companies was not their tools or their budget. It was five specific practices.
They maintained a tracking plan. The two optimized companies both had living documents that specified every tracked event, its parameters, where it fired, and who was responsible for it. When a new feature launched, the tracking plan was updated as part of the release process, not as an afterthought.
They ran regular QA. Both companies had automated tests that verified critical tracking events on a weekly basis. When something broke, they knew within days, not months.
They limited their tool count. Neither company had more than three analytics tools. As Gartner’s marketing analytics research has shown, tool proliferation is inversely correlated with analytics effectiveness. The companies I audited confirmed this completely.
They assigned ownership. Analytics was someone’s explicit responsibility, not a shared duty that everyone assumed someone else was handling. Whether it was a dedicated analytics engineer or a marketing ops lead with analytics in their job description, there was a clear owner.
They reviewed monthly. A standing monthly meeting to review data quality, check for anomalies, and validate that key metrics still made sense. This single practice caught more issues than any automated monitoring.
Dr. Judea Pearl, the Turing Award-winning computer scientist known for his work on causal inference, has a principle that applies directly here: “Data alone is not enough. You need a model of the process that generated the data.” The best analytics setups I encountered were the ones where the team understood not just what they were measuring, but why and how.
Actionable Takeaways
If you are running analytics at a SaaS company and you have not done a formal audit recently, here is what I would recommend based on everything I have seen.
Start with a tracking inventory. List every tracking script, tag, and pixel on your site. Use your browser’s developer tools or a tool like ObservePoint to scan for all active tags. You will almost certainly find scripts you did not know were there.
Verify your conversion events. Manually walk through every conversion path on your site and confirm that the expected events fire correctly. Check the actual data arriving in your analytics platform, not just the tag manager preview mode. I have seen tags that fire correctly in preview but fail in production due to timing issues or consent management conflicts.
Check for duplicates. Look at your event counts over the past 30 days. If you see sudden jumps, perfectly round multipliers, or counts that seem implausibly high, you likely have duplicate firing. The Google Analytics 4 DebugView is useful for catching these in real time.
Audit your consent implementation. Do not just check that your consent banner appears. Open your browser’s network tab, decline all cookies, and see what requests still fire. If tracking requests go out before or despite consent being denied, you have a compliance gap.
Cancel what you do not use. If your team has not logged into an analytics tool in the past 30 days, you probably do not need it. If two tools provide overlapping data, pick one and cancel the other. Simplification is almost always the right move.
Create a tracking plan. Even a simple spreadsheet listing your events, their parameters, and their purposes is infinitely better than nothing. The tracking plan template from Amplitude is a solid starting point.
Set up monitoring. At minimum, create alerts for when key event counts drop by more than 30% day-over-day. This single step would have caught the majority of the tracking failures I discovered during audits, weeks or months earlier.
Schedule recurring reviews. Block one hour per month to review your analytics health. Check data quality, verify key events, review tool usage, and update your tracking plan. Make it a calendar event that does not get skipped.
The Bottom Line
After auditing analytics at 15 SaaS companies, the lesson I keep coming back to is this: the problem is almost never a lack of data. It is a lack of attention to the quality of the data you already have.
Every company I audited was collecting data. Most were collecting too much of it. But the gap between collecting data and having reliable, actionable analytics was enormous. And that gap was costing them real money, through wasted tool spend, misallocated marketing budgets, and decisions made on faulty information.
The fix is rarely expensive or complicated. It starts with acknowledging that your analytics setup is probably not as healthy as you think it is, and then doing the methodical, unglamorous work of auditing, documenting, and maintaining it.
If you take one thing from this piece, let it be this: schedule an audit. Not next quarter. This week. The issues you find will almost certainly pay for the time it takes to find them.
FAQ
How long does a SaaS analytics audit typically take?
Based on my experience, a thorough audit takes between one and three weeks depending on the complexity of the setup. Companies with fewer tools and cleaner implementations can be audited in about a week. Companies with sprawling martech stacks, multiple tag manager containers, and no documentation typically take the full three weeks. The initial triage, where you identify the most critical issues, usually takes two to three days.
What is the most common mistake SaaS companies make with their analytics?
The single most common mistake I found was not monitoring analytics data quality on an ongoing basis. Companies invest time and money in setting up tracking, then never check whether it continues to work correctly. Tracking breaks silently. Without monitoring, those breaks go undetected for weeks or months, leading to decisions based on incomplete or inaccurate data.
How often should SaaS companies audit their analytics setup?
I recommend a full audit at least once per year, with lighter monthly reviews. The monthly review should take about an hour and focus on verifying key event counts, checking for anomalies, and confirming that recently launched features are being tracked correctly. A full audit, where you review every tag, validate every conversion, and assess tool usage, should happen annually or after any major website or product changes.
Do I need a dedicated analytics hire to maintain good data quality?
Not necessarily, though it helps. Of the two companies in my audit pool with optimized analytics setups, one had a dedicated analytics engineer and the other assigned analytics ownership to their marketing ops lead as about 30% of that person’s role. The key factor was not having a dedicated hire. It was having someone who was explicitly accountable. When analytics is “everyone’s responsibility,” it becomes no one’s responsibility.
What tools do I need to run my own analytics audit?
You can run a meaningful audit with free tools. Use your browser’s developer tools (Network tab) to see what scripts load and what data they send. Use Google Tag Manager’s preview mode to verify tag firing. Use GA4 DebugView to check events in real time. For a more comprehensive scan, tools like ObservePoint or Tag Inspector offer automated tag auditing, but they are not strictly necessary for a first pass. The most important tool is a spreadsheet where you document what you find.