Every SaaS marketing team I’ve worked with has the same problem: too many dashboards, too many metrics, and not enough clarity on what actually moves the business forward. After a decade of building analytics stacks for B2B SaaS companies, I’ve watched teams drown in data while missing the signals that matter.
This isn’t another listicle of “top 25 marketing metrics.” This is an opinionated framework for the SaaS marketing KPIs that actually drive decisions — and the vanity metrics you should stop reporting on immediately.
Why Most SaaS Marketing Dashboards Fail
The core issue is deceptively simple: most marketing teams measure what’s easy to measure rather than what’s important to measure. Google Analytics gives you pageviews by default, so pageviews go on the dashboard. Your email platform shows list size, so list size becomes a KPI. Before you know it, your weekly report has 30 metrics and nobody can tell you whether marketing is actually working.
As Brian Balfour at Reforge has argued, metrics only matter if they’re connected to a growth model. A KPI that doesn’t change your next decision isn’t a KPI — it’s decoration.
I learned this lesson the hard way. In 2019, I was consulting for a Series A SaaS company that was proud of their 400% year-over-year increase in blog traffic. The CMO presented it to the board every quarter. The problem? Their CAC had increased by 60% in the same period because all that traffic was top-of-funnel content attracting people who would never buy. They were optimizing for the wrong metric.
The SaaS Marketing KPIs That Actually Matter
1. Customer Acquisition Cost (CAC) by Channel
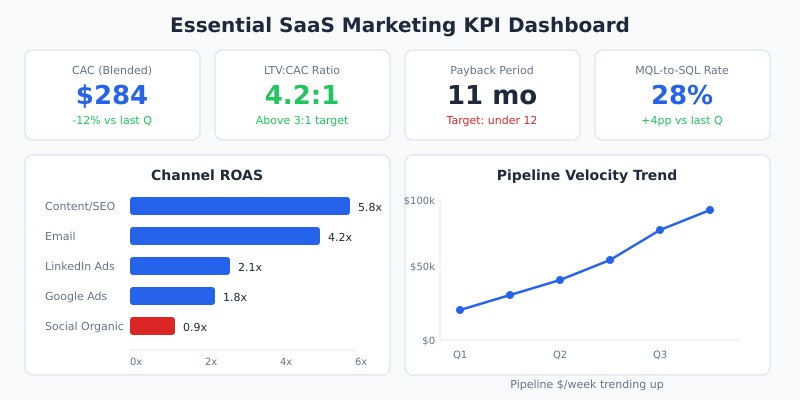
Not blended CAC — CAC by channel. Blended CAC is useful for board reporting, but it hides the information you need to actually allocate budget. If your blended CAC is $300, but your content marketing CAC is $120 and your LinkedIn Ads CAC is $580, those two numbers tell very different stories about where your next dollar should go.
Calculate it monthly, with a one-quarter lag for content and SEO (since those channels have delayed conversion cycles). Include fully loaded costs: team salaries allocated by time spent, tools, agency fees, ad spend — everything.
2. Lifetime Value (LTV) and the LTV:CAC Ratio
LTV alone is helpful but incomplete. The LTV:CAC ratio is the metric that tells you whether your business model is actually sustainable. The commonly cited benchmark is 3:1 — for every dollar you spend acquiring a customer, you should generate three dollars in lifetime revenue.
In my experience, healthy B2B SaaS companies land between 3:1 and 5:1. Below 3:1, you’re spending too much on acquisition or not retaining well enough. Above 5:1, you’re probably underinvesting in growth — which sounds like a good problem to have, but it usually means competitors are outpacing you.
David Skok of For Entrepreneurs has written extensively about this ratio, and his framework remains one of the best references for SaaS unit economics. What I’d add from my own experience is that you should calculate LTV:CAC per channel and per customer segment, not just as a blended number.
3. CAC Payback Period
This is the metric that keeps CFOs up at night — and it should keep marketing leaders up too. Payback period measures how many months it takes to recover the cost of acquiring a customer through their subscription revenue.
For most SaaS companies, 12 months or less is the target. Between 12 and 18 months is workable if you have strong retention. Above 18 months, and your cash flow is going to be a serious constraint on growth.
The payback period is especially important at the Series A and B stages, where capital efficiency matters more than raw growth. I’ve seen companies with impressive MRR growth that were actually in trouble because their payback period had crept up to 20+ months as they scaled paid channels.
4. Pipeline Velocity
Pipeline velocity combines four variables into one metric: the number of qualified opportunities, average deal value, win rate, and length of sales cycle. The formula is:
Pipeline Velocity = (Qualified Opportunities x Average Deal Value x Win Rate) / Sales Cycle Length
What I like about pipeline velocity is that it forces marketing and sales to share a metric. Marketing influences the top (qualified opportunities), sales influences the bottom (win rate and cycle length), and both affect deal value through positioning and targeting.
Track it weekly. It’s the single best leading indicator of whether next quarter’s revenue target is achievable.
5. MQL-to-SQL Conversion Rate
This metric is the canary in the coal mine for lead quality. If your MQL-to-SQL rate is dropping, it means marketing is sending worse leads to sales — regardless of how many MQLs you’re generating. I’ve seen teams celebrate hitting their MQL targets while their MQL-to-SQL rate fell from 35% to 15%, which meant sales was actually getting fewer qualified leads than the previous quarter.
Healthy MQL-to-SQL rates vary significantly by industry and sales model, but for B2B SaaS, 20-35% is a solid range. Below 15%, you need to revisit your MQL definition. Above 40%, your criteria might be too strict and you’re leaving pipeline on the table.
6. Channel-Specific ROAS
Return on ad spend by channel is straightforward but often poorly implemented. The mistake I see most frequently: calculating ROAS using attributed pipeline rather than closed-won revenue. Pipeline is a forecast. Revenue is reality. Use revenue.
For non-paid channels like content and SEO, I calculate an equivalent ROAS by dividing attributed revenue by the fully loaded cost of the content team. It’s imperfect but far better than treating content as “free.”
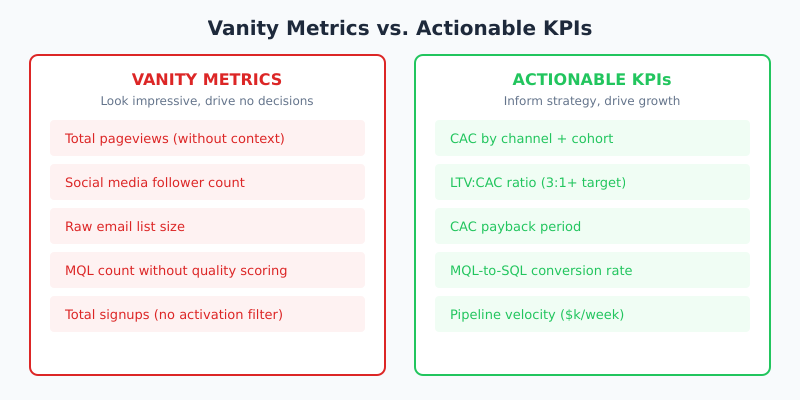
The Metrics You Should Stop Reporting
This is where I’ll make some enemies. These metrics aren’t useless in isolation, but they become actively harmful when they’re treated as KPIs — because teams start optimizing for them at the expense of metrics that actually matter.
Pageviews (Without Conversion Context)
Pageviews tell you how many times a page loaded. They don’t tell you whether anyone who loaded that page is remotely likely to become a customer. I’ve seen content teams build entire strategies around driving pageviews because that’s what the dashboard rewarded, producing content that attracted huge audiences of people who would never buy the product.
If you must track traffic, track it alongside conversion rate by landing page. A page with 500 visits and a 5% conversion rate is more valuable than a page with 50,000 visits and a 0.01% conversion rate.
Social Media Followers
Follower count is the quintessential vanity metric for B2B SaaS. The correlation between social followers and revenue is, in my experience, essentially zero. I’ve worked with companies that had 50,000 LinkedIn followers and almost no attributable pipeline from social, and companies with 2,000 followers that generated meaningful deal flow through targeted engagement.
If social is part of your strategy, measure engagement rate and, more importantly, content-attributed pipeline from social channels.
Email List Size (Without Engagement)
A 50,000-person email list sounds impressive until you realize 60% hasn’t opened an email in six months. Raw list size tells you nothing about marketing effectiveness. Track engaged subscribers (opened or clicked in the last 90 days) and conversion rate from email to pipeline instead.
MQL Volume Without Quality Scoring
I saved this one for last because it’s the most controversial — and the most damaging. MQL targets without quality gates create a perverse incentive: marketing teams generate leads that technically meet the MQL threshold but are unlikely to convert to customers. The result is a sales team drowning in low-quality leads and an increasingly adversarial marketing-sales relationship.
As Tomasz Tunguz of Theory Ventures has noted, the best SaaS teams align marketing and sales around revenue outcomes, not lead handoff counts. MQL volume should always be paired with MQL-to-SQL rate and SQL-to-close rate.
Choosing KPIs by Company Stage
One of the biggest mistakes I see is applying the same KPI framework regardless of company stage. A seed-stage startup and a $50M ARR company need fundamentally different metrics. Here’s how I think about it.
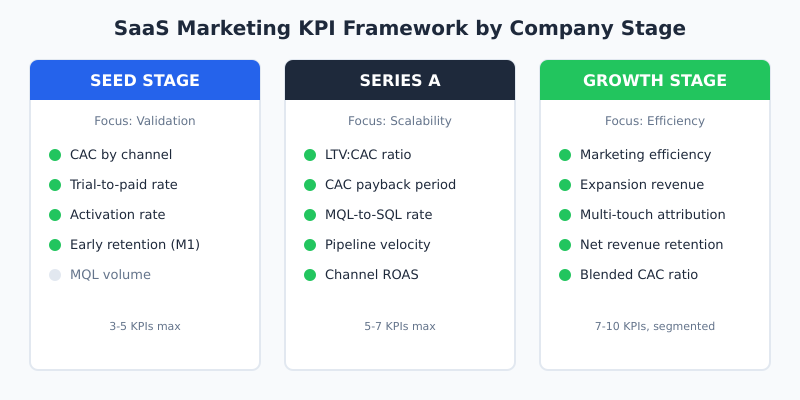
Seed Stage: Validation Over Volume
At seed stage, you’re trying to prove that you can acquire customers at a cost that makes your business model viable. You don’t need 15 marketing KPIs. You need three to five.
Focus on: CAC by channel (even if you only have 2-3 channels), trial-to-paid conversion rate, activation rate, and month-one retention. That’s it. Everything else is noise at this stage.
The temptation at seed stage is to track MQL volume because it makes your fundraising narrative look better. Resist it. Investors who understand SaaS will be more impressed by a 40% trial-to-paid rate with small numbers than a mountain of unqualified leads.
Series A: Proving Scalability
At Series A, you’ve validated product-market fit and now you need to prove that customer acquisition scales. This is where the LTV:CAC ratio and payback period become critical. You’re also building out a real marketing team, so MQL-to-SQL rate and pipeline velocity enter the picture.
Focus on: LTV:CAC ratio, CAC payback period, MQL-to-SQL conversion rate, pipeline velocity, channel-specific ROAS. Five to seven KPIs, tracked monthly and reported quarterly.
The key insight at this stage: your CAC will almost certainly increase as you scale beyond your initial channels. That’s expected. The question is whether it increases proportionally to revenue or whether it’s growing faster. If CAC is growing faster than revenue, you have a scaling problem that more budget won’t solve.
Growth Stage: Efficiency and Segmentation
At $10M+ ARR, you need more sophisticated measurement. Blended metrics start hiding important segment-level variation. Your enterprise CAC might be 3x your mid-market CAC, and your expansion revenue might be masking new-logo acquisition challenges.
Focus on: All of the Series A metrics, plus marketing efficiency ratio (new ARR / marketing spend), expansion revenue attribution, multi-touch attribution modeling, net revenue retention influenced by marketing, and blended CAC ratio segmented by market tier.
At this stage, I also recommend implementing a formal attribution model. Linear, time-decay, or data-driven — the specific model matters less than having a consistent framework that the entire go-to-market team agrees on.
Building Your KPI Dashboard: Practical Advice
After setting up marketing dashboards for dozens of SaaS companies, here’s what I’ve learned about making them actually useful.
Limit your primary dashboard to 7 metrics or fewer. If it takes more than 30 seconds to scan, nobody will look at it. Put secondary metrics in a drill-down view.
Set thresholds, not just targets. Every KPI should have three zones: green (on track), yellow (needs attention), and red (requires immediate action). This turns your dashboard from a reporting tool into a decision-making tool.
Review weekly, act monthly, report quarterly. Weekly reviews catch problems early. Monthly is the right cadence for strategic adjustments (you need at least four weeks of data to distinguish signal from noise). Quarterly reporting gives you enough sample size for meaningful trend analysis.
Make every metric someone’s responsibility. A KPI without an owner is just a chart on a screen. Assign every metric to a specific person who can explain movements and propose actions.
One framework I’ve found helpful comes from Reforge’s North Star Metric methodology: identify your single most important metric (often pipeline velocity or marketing-sourced revenue), then track the 4-6 input metrics that drive it. This creates a clear hierarchy rather than a flat list of unrelated numbers.
My Personal Framework
If I had to walk into a new SaaS company tomorrow and set up their marketing measurement from scratch, here’s exactly what I’d do in the first 30 days:
Week 1: Audit existing data sources and tracking. Fix any broken attribution. You’d be surprised how often UTM parameters are inconsistent or CRM integrations are dropping data.
Week 2: Define CAC, LTV, and payback period calculations with the finance team. Get agreement on methodology before you build dashboards. The number one source of marketing-finance conflict is disagreeing on how these metrics are calculated.
Week 3: Build the primary dashboard with the 5-7 KPIs appropriate for the company’s stage. Use existing tools — Looker, Tableau, or even a well-structured Google Sheet. The tool matters far less than the metrics.
Week 4: Run the first weekly review. Identify the biggest gap between current performance and target. That gap becomes the team’s focus for the next quarter.
No company needs 30 marketing KPIs. Most need fewer than 10. The discipline isn’t in measuring more — it’s in measuring less, but measuring the right things with enough rigor to actually drive decisions.
As Elena Verna, growth advisor at companies like Miro and Amplitude, puts it: “The best growth teams are ruthless about which metrics they track. Every metric on your dashboard should have a clear ‘so what’ — if it moves, you know exactly what action to take.”
Start with the KPIs that matter. Ignore the vanity metrics. And remember: the goal isn’t a prettier dashboard. It’s a marketing team that knows exactly where to invest its next dollar.
FAQ
What are the most important SaaS marketing KPIs for early-stage startups?
For seed and early-stage SaaS companies, focus on CAC by channel, trial-to-paid conversion rate, activation rate, and month-one retention. Keep your KPI count to 3-5 metrics maximum. At this stage, you’re validating that your acquisition model works, not optimizing for scale. Avoid tracking vanity metrics like raw pageviews or social followers that distract from the core question of whether your business model is viable.
What is a good LTV:CAC ratio for B2B SaaS?
The widely accepted benchmark is 3:1 — your customer lifetime value should be at least three times your customer acquisition cost. Healthy B2B SaaS companies typically land between 3:1 and 5:1. Below 3:1 indicates you’re either spending too much on acquisition or not retaining customers well enough. Above 5:1 may suggest you’re underinvesting in growth and could be more aggressive with marketing spend to capture market share.
How do you calculate pipeline velocity for SaaS marketing?
Pipeline velocity is calculated as: (Number of Qualified Opportunities x Average Deal Value x Win Rate) / Average Sales Cycle Length in Days. For example, if you have 50 qualified opportunities, a $10,000 average deal, a 25% win rate, and a 60-day sales cycle, your pipeline velocity is $2,083 per day. Track this weekly as a leading indicator of future revenue performance.
Why are MQLs considered a vanity metric?
MQLs aren’t inherently a vanity metric, but they become one when tracked as volume without quality gates. MQL count without conversion context creates a perverse incentive: marketing teams optimize for hitting lead quantity targets rather than generating leads likely to convert to customers. Always pair MQL volume with MQL-to-SQL conversion rate and SQL-to-close rate to get the full picture of lead quality.
How often should SaaS marketing teams review their KPI dashboards?
Review your primary KPIs weekly to catch emerging problems early, make strategic adjustments on a monthly cadence (you need at least four weeks of data to separate signal from noise), and report trends quarterly for board-level analysis. Every metric should have a designated owner who can explain movements and propose corrective actions when a KPI enters the yellow or red zone.