In 2021, Google made data-driven attribution the default model in Google Ads. In 2023, they pushed it to GA4. And now in 2026, if you’re still manually selecting last-click attribution, you’re actively choosing worse data.
But here’s what most marketers miss: data-driven attribution isn’t magic. It’s a machine learning model with specific requirements, limitations, and use cases where it excels — and others where it fails completely.
I’ve implemented data-driven attribution for dozens of SaaS companies, and I’ve seen both the wins and the spectacular failures. This guide explains exactly how it works, when to use it, and when to choose something else entirely.
What Is Data-Driven Attribution?
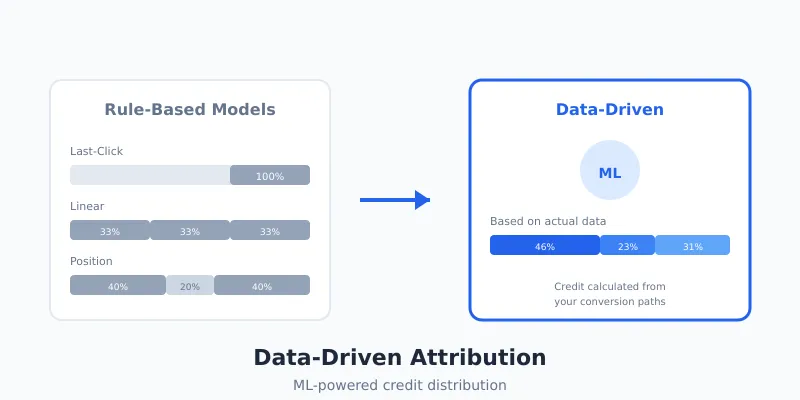
Data-driven attribution (DDA) is a machine learning model that analyzes your actual conversion data to determine how much credit each marketing touchpoint deserves. Unlike rule-based models (first-touch, last-touch, linear), it doesn’t follow pre-set formulas — it learns from your data.
The key difference: traditional models apply the same rules to everyone. Data-driven attribution calculates credit based on what actually works for your specific business, customers, and conversion paths.

How It Differs from Rule-Based Models
| Model | How Credit Is Assigned | Best For |
|---|---|---|
| Last-Click | 100% to final touchpoint | Short sales cycles, direct response |
| First-Click | 100% to first touchpoint | Brand awareness campaigns |
| Linear | Equal credit to all touchpoints | When all touches matter equally |
| Time Decay | More credit to recent touchpoints | Long sales cycles, promotions |
| Position-Based | 40% first, 40% last, 20% middle | Balanced view of funnel |
| Data-Driven | ML-calculated based on actual impact | High-volume businesses with clean data |
How Data-Driven Attribution Works
Data-driven attribution uses a methodology called Shapley value, borrowed from cooperative game theory. Here’s the simplified version of what happens under the hood:
Step 1: Path Analysis
The algorithm analyzes all conversion paths in your data — the sequences of touchpoints that led (or didn’t lead) to conversions.
For example:
- Path A: Google Ads → Email → Facebook → Conversion
- Path B: Google Ads → Email → No Conversion
- Path C: Facebook → Google Ads → Conversion
- Path D: Email → Facebook → No Conversion
Step 2: Counterfactual Analysis
The model asks: “What would have happened if this touchpoint wasn’t in the path?” It compares conversion rates with and without each channel to determine incremental impact.
If paths with Google Ads convert at 5% and paths without Google Ads convert at 2%, Google Ads gets credit for that 3% lift.

Step 3: Shapley Value Calculation
The Shapley value formula considers every possible combination of touchpoints and calculates each channel’s marginal contribution. This ensures fair credit distribution regardless of path order.
The math is complex, but the concept is simple: channels that consistently appear in converting paths (and are absent from non-converting paths) get more credit.
Step 4: Credit Distribution
Finally, the model distributes conversion credit across touchpoints based on their calculated impact. Unlike linear attribution (which might give 33% to each of three touches), DDA might give 50% to the first touch, 35% to the second, and 15% to the third — if that’s what the data shows.
Data Requirements for Data-Driven Attribution
Here’s where most implementations fail: data-driven attribution requires significant data volume to work properly. Without enough conversions, the model can’t identify meaningful patterns.
Google Ads Requirements
For Google Ads DDA to work, you need:
- 300 conversions in the past 30 days for the specific conversion action
- 3,000 ad interactions in supported networks during that period
- These thresholds must be maintained — drop below and DDA stops working
If you don’t meet these thresholds, Google automatically falls back to last-click attribution.
GA4 Requirements
GA4’s data-driven attribution is less strict but still needs:
- Enough conversion events to identify patterns (Google doesn’t publish exact numbers)
- Consistent tracking across channels and touchpoints
- Properly configured conversion events with clear user identification
In practice, I’ve seen GA4 DDA produce unreliable results with fewer than 500 monthly conversions. For stable, trustworthy attribution, aim for 1,000+ conversions per month.

When Data-Driven Attribution Works Best
DDA excels in specific scenarios. Here’s where I consistently see it outperform rule-based models:
High-Volume E-commerce
E-commerce sites with 1,000+ monthly transactions have the data volume DDA needs. The model can identify which touchpoint combinations actually drive purchases, often revealing that certain “assist” channels deserve more budget than last-click would suggest.
Multi-Channel Marketing
If you’re running campaigns across 5+ channels (Google, Facebook, LinkedIn, email, organic, etc.), DDA helps untangle the complexity. It shows how channels work together rather than competing for credit.
Complex Customer Journeys
When your average conversion path has 4+ touchpoints, rule-based models become increasingly arbitrary. DDA adapts to your actual journey complexity.
Google Ads Optimization
If you’re using Google’s Smart Bidding, DDA gives the algorithm better signals. Smart Bidding uses attribution data to optimize bids — better attribution means better bid optimization.
When Data-Driven Attribution Fails
DDA isn’t universal. Here’s when I recommend against it:
| Use DDA When | Avoid DDA When |
|---|---|
|
|
Low Conversion Volume
With fewer than 300-500 monthly conversions, DDA doesn’t have enough data to identify patterns. The model becomes unstable, and attribution shifts randomly month-to-month. Stick with a simpler model until you scale.
B2B with Extended Sales Cycles
B2B SaaS companies with 6+ month sales cycles face a fundamental problem: by the time you have conversion data, the marketing that influenced those deals is ancient history. DDA struggles with these time gaps.
Single-Channel Dominance
If 80%+ of your conversions come from one channel, DDA adds complexity without insight. You already know what’s working.
Stakeholder Transparency Needs
DDA is a black box. If your CFO asks “why did this channel get 37.4% credit?”, you can’t give a satisfying answer beyond “the algorithm said so.” For organizations that need explainable attribution, rule-based models are easier to defend.
Implementing Data-Driven Attribution
In Google Ads
To enable DDA in Google Ads:
- Go to Tools & Settings → Measurement → Conversions
- Select the conversion action you want to modify
- Click Edit settings
- Under Attribution model, select Data-driven
- Click Save
Note: If DDA isn’t available, you don’t have enough conversion data. Google will show which models are available based on your volume.
In GA4
GA4 uses data-driven attribution by default in certain reports. To configure it:
- Go to Admin → Data display → Attribution settings
- Select your Reporting attribution model (Data-driven is default)
- Set your Lookback window (conversion and engaged-view)
- Click Save
You can also compare attribution models in the Model Comparison report under Advertising.
Cross-Platform Attribution
Google’s DDA only sees Google-tracked touchpoints. For true cross-platform attribution, you need dedicated attribution tools like:
- HockeyStack — B2B-focused, strong CRM integration
- Dreamdata — Account-based attribution for B2B
- Rockerbox — E-commerce focused, unified measurement
- Triple Whale — DTC brands, strong Shopify integration
These platforms implement their own data-driven models that can attribute across walled gardens (Google, Meta, etc.).
Interpreting Data-Driven Attribution Results
When you switch to DDA, expect credit to shift. Here’s what to look for:

Upper-Funnel Channels Often Gain Credit
Display ads, YouTube, and social typically gain credit when switching from last-click to DDA. These channels introduce customers who later convert through brand search or direct — DDA recognizes their contribution.
Brand Search Usually Loses Credit
Brand search campaigns often lose significant credit. Last-click gives them 100% of conversions, but DDA recognizes that customers searching your brand name were likely influenced by earlier touchpoints.
What to Do with the Data
Don’t immediately reallocate budget based on one month of DDA data. Instead:
- Run parallel models for 60-90 days to see how attribution differs
- Look for consistent patterns, not one-time anomalies
- Validate with incrementality tests — geo-holdout experiments confirm DDA’s conclusions
- Shift budget gradually (10-20% at a time) and measure impact
Common Mistakes with Data-Driven Attribution
After auditing dozens of DDA implementations, these are the errors I see most often:
Mistake 1: Using DDA with Insufficient Data
Many marketers enable DDA without checking if they meet data requirements. The result: unstable attribution that changes dramatically month-to-month, making optimization impossible.
Fix: Check your conversion volume before enabling. If you’re below 300 monthly conversions per action, use position-based or time-decay instead.
Mistake 2: Ignoring Conversion Window Settings
DDA results change dramatically based on your conversion window. A 7-day window shows very different attribution than a 90-day window.
Fix: Set your conversion window to match your actual sales cycle. B2C might use 7-30 days; B2B SaaS typically needs 60-90 days.
Mistake 3: Treating DDA as Ground Truth
DDA is a model, not reality. It’s making educated guesses based on correlations. External factors (PR coverage, competitor changes, seasonality) aren’t captured.
Fix: Use DDA as one input among many. Combine with MMM (marketing mix modeling), incrementality tests, and qualitative customer research.
Mistake 4: Not Considering Walled Garden Limitations
Google’s DDA only sees Google touchpoints. Meta’s attribution only sees Meta touchpoints. Neither sees the full picture.
Fix: Use a third-party attribution platform or accept that you’re seeing partial truth from each walled garden.
FAQ
Is data-driven attribution more accurate than last-click?
For multi-touch customer journeys with sufficient conversion volume, yes. DDA recognizes that customers interact with multiple channels before converting, while last-click ignores everything except the final touchpoint. However, “more accurate” assumes you have enough data — with low volume, DDA can be less reliable than simpler models.
How long does data-driven attribution take to learn?
Google’s DDA typically needs 30 days of data to establish initial patterns. However, the model continuously learns and updates. Major changes to your marketing mix (new channels, significantly different budget allocation) may require 2-4 weeks to stabilize in the attribution model.
Can I use data-driven attribution for offline conversions?
Yes, if you’re importing offline conversions into Google Ads or GA4. The model will include offline conversions in its analysis. However, the quality depends on your offline conversion tracking — incomplete or delayed imports create gaps in the model’s learning data.
Why did my branded search performance drop after switching to DDA?
This is expected. Last-click gave brand search 100% credit for conversions where it was the final touch. DDA redistributes credit to earlier touchpoints that actually influenced the customer’s decision to search your brand. Your brand search isn’t performing worse — it’s being measured more accurately.
Should I use the same attribution model in Google Ads and GA4?
Ideally, yes — consistency makes cross-platform analysis easier. However, they serve different purposes: Google Ads attribution optimizes bidding within Google’s ecosystem, while GA4 shows cross-channel performance. Many organizations use DDA in both but recognize they’re seeing two different perspectives on the same customer journeys.
Conclusion
Data-driven attribution represents a significant improvement over arbitrary rule-based models — when you have the data to support it. For high-volume businesses with complex, multi-channel customer journeys, DDA provides insights that simpler models miss entirely.
But it’s not magic. DDA is a statistical model with real limitations:
- It needs substantial conversion volume to work reliably
- It only sees what you track (walled gardens limit visibility)
- It can’t explain why it assigns specific credit amounts
- It struggles with very long B2B sales cycles
My recommendation: if you have 500+ monthly conversions across multiple channels, enable DDA and run it alongside your current model for 90 days. Compare results, validate with incrementality tests, and gradually shift budget based on consistent patterns — not single-month anomalies.
Attribution is never “solved.” But data-driven attribution gets you closer to understanding what’s actually driving your marketing results.